Today, the US market is flooded with a variety of hospital awards. While each ranking system claims to identify the best quality healthcare providers in the nation, rarely will they agree on who those providers are. One study examined four different ranking systems’ evaluations of 844 hospitals, and found that only 10% of the hospitals ranked as high quality by one system were also ranked as a high performer by any of the other systems.[i] Systems that were designed to bring some much needed transparency to American healthcare instead only further cloud the issue, leaving consumers and healthcare professionals grappling with who to trust and where to find true quality care.
Why do scores vary so widely? Why don’t all the ranking systems agree on who is providing the best care? And what can we do to simplify the already complicated process of selecting a healthcare provider?
Healthcare is a complex field, and as a result, there are a variety of factors considered and included when scoring and ranking hospitals. An exploration of these factors, and their practical effects upon final ranking results, will hopefully bring some clarity and allow people to make an educated choice on which awards to trust.
Who is Eligible?
Before any awards are even given out, companies have a critical decision to make: who is in the pool of candidates being considered?
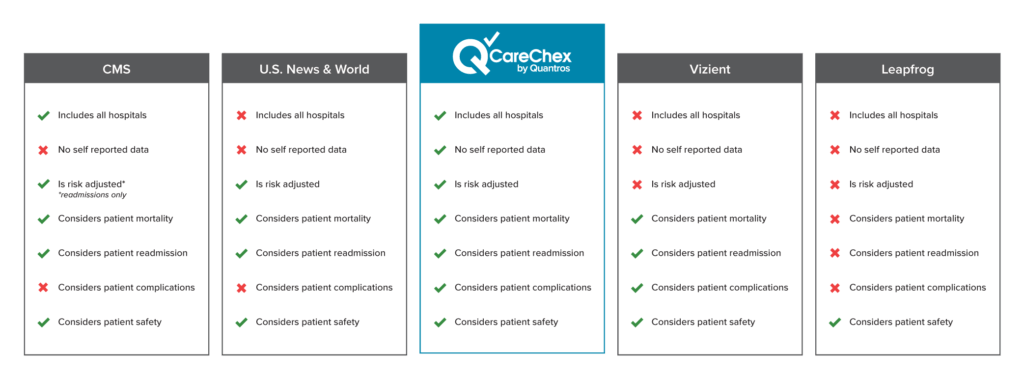
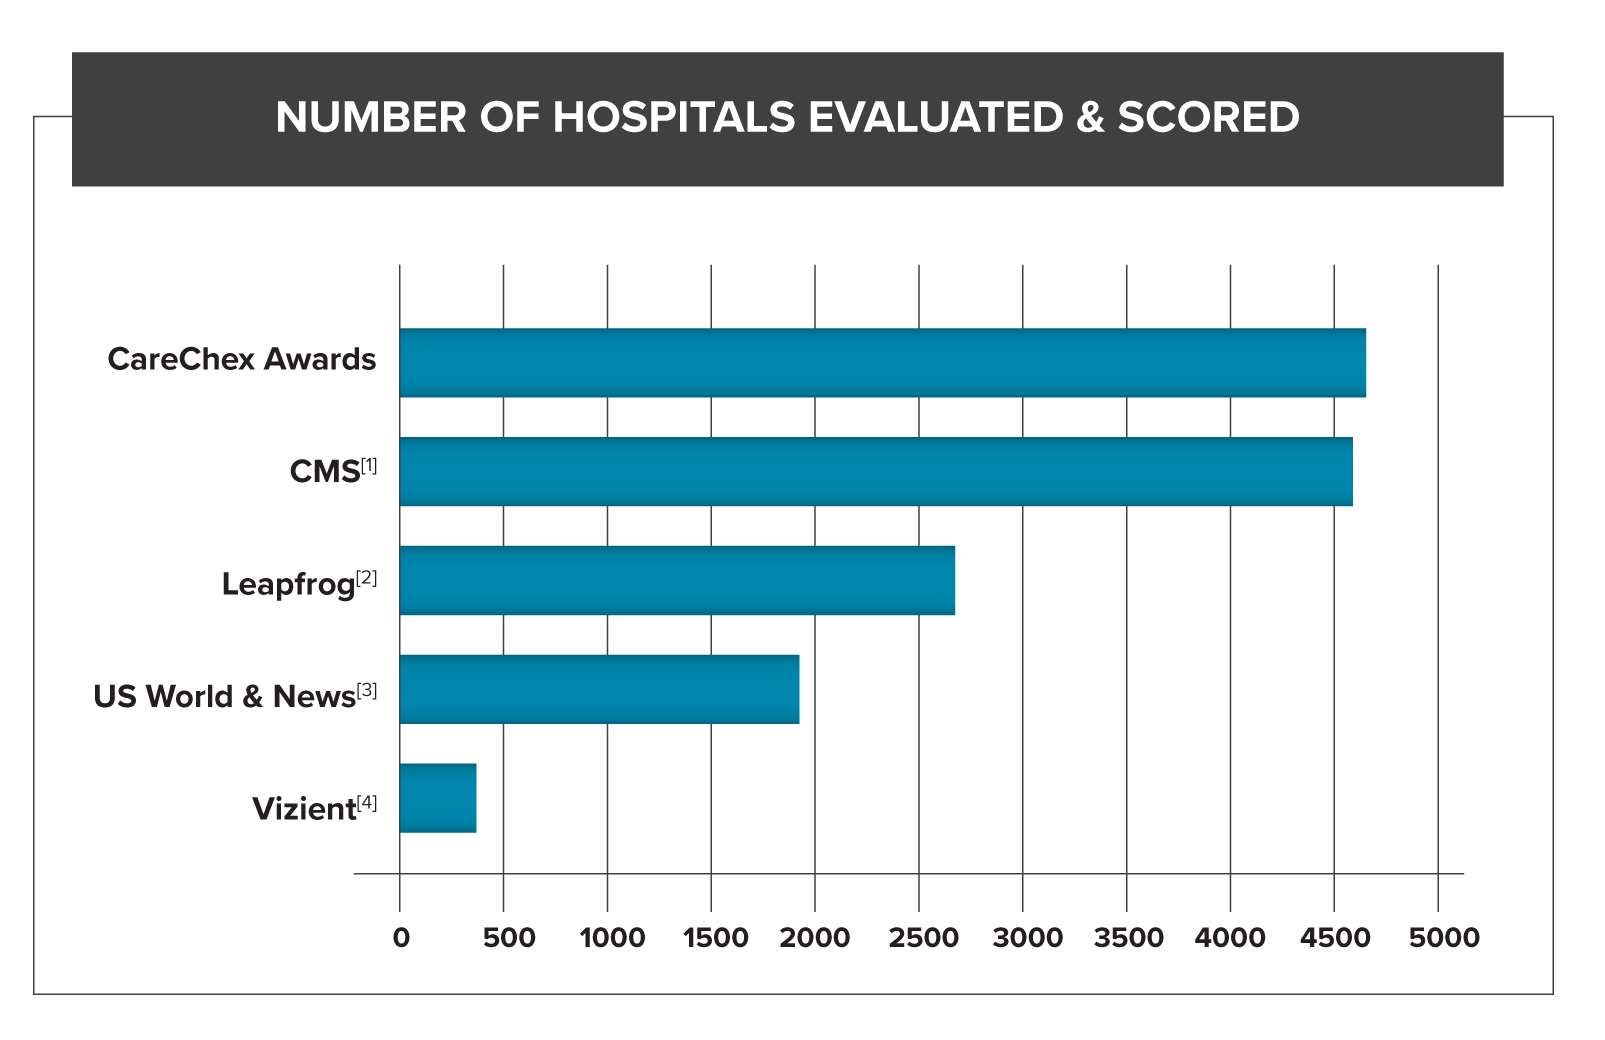
Since CMS’s Star Rating is fueled by Medicare fee-for-service claims, there are an enormous amount of hospitals considered in its ranking. In 2019 they scored more than 4,700 hospitals within the US.[ii]
US News and World Report relies on Medicare fee-for-service claims as well, but includes additional, strict eligibility requirements: association with a medical school, bed size, technology available within the hospital, and number of severe and complex patients seen. These requirements drastically reduce the number of hospitals actually examined.[iii] Leapfrog has a similar model, imposing restrictions around ICU staffing, CPOE adoption, and commitments to patient safety initiatives.[iv]
Other ranking systems, such as Vizient, are “pay to play:” they only rank their own clients.[v] In 2018 Vizient had 400 hospitals participate in their hospital ranking. [vi] Quantros, which follows CMS’s lead and scores all non-federal acute care inpatient hospitals ,scored thousands of hospitals that same year.
What are the practical implications of differing candidates pools?
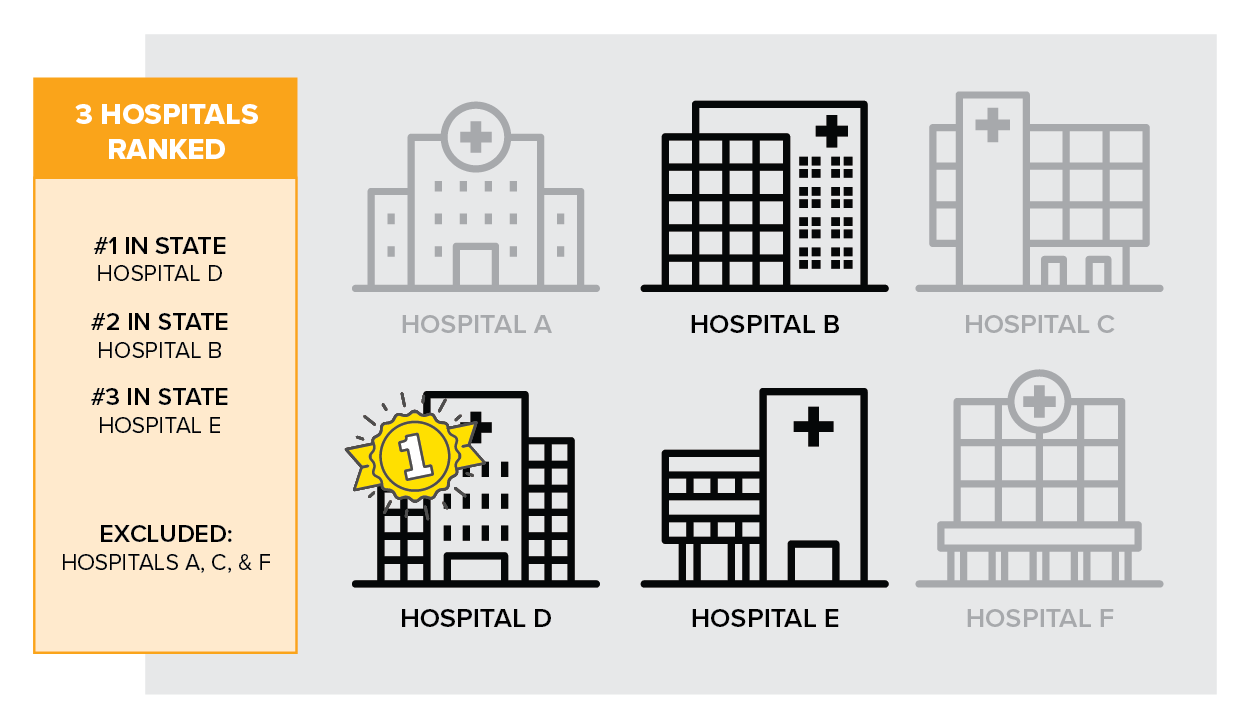
For one, a smaller pool of candidates can lead to less meaningful results. Of the two hospitals below, which would you choose?
Hospital A
#2 in the state (compared to 50 hospitals)
Hospital B
#2 in the state (compared to 5 hospitals)
This can also skew the results. Hospitals who are, on average, performing better or worse may can end up being excluded. Or, an individual’s performance can appear more impressive when compared against a smaller pool, especially if the sample of hospitals isn’t truly representative of the whole.
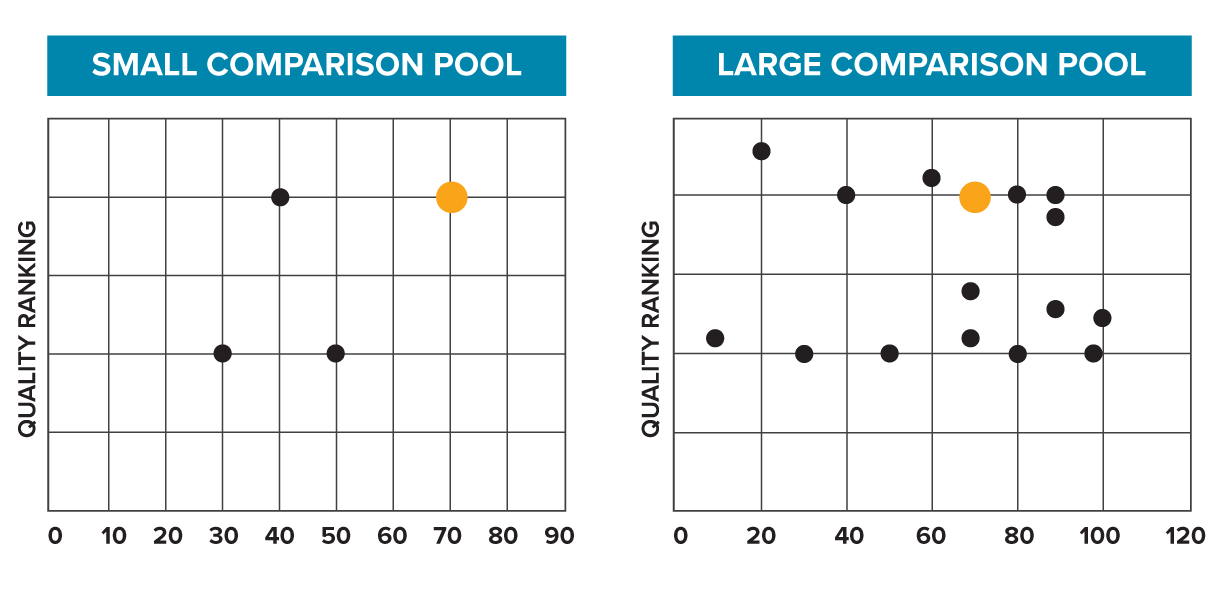
While originally this hospital (orange dot) may have appeared to be a top performer, when the comparison pool is widened, it is revealed they are really closer to middle of the pack.
Finally, the smaller your candidate pool, the more incomplete the picture you paint. You risk excluding some great quality, high performing healthcare providers.
What is your data source?
The source of the data fueling any hospital ranking system matters immensely. Understanding where the data comes from, the performance time period, and types of patients included are all paramount in grasping the significance of the awards.
As counterintuitive as it may seem, and as reluctant we as patients may be to believe it, there is actually no correlation between patient satisfaction and quality of care.[vii] In fact, one study showed patients with higher levels of satisfaction also had higher rates of mortality and hospitalization.[viii]
An additional problem with survey data is patients can unjustly punish physicians who didn’t comply with their requests with negative survey responses, such as a physician who denies a patient an opioid prescription or a risky elective procedure.
Patient survey data makes up almost a quarter of CMS’s star rating.[ix] This skews their results to favor physicians with great bedside manner, instead of physicians who are cost effective, discharge their patients home quickly, and have low rates of complications and readmissions.
While US News and World Report weighs patient satisfaction much less heavily (it only composes 5% of their overall score), they also include physician surveys.[x] In fact, more than 27% of their overall score is based on “expert opinion,” where physicians weigh in on who they believe are the best hospitals, irrespective of location or cost.[xi] Anytime survey data is incorporated into a ranking mechanism, whether it’s patient surveys or physician surveys, it brings us further away from objective data. Subjective opinions are not reliable indicators of quality, and relying on them can lead to biased results.
Leapfrog uses a mix of Medicare data and self-reported data that some hospitals volunteer;[xii] because their survey isn’t mandatory, not all hospitals participate, and hospitals that do participate choose what to report. Response bias in this self-reported data can highlight patients with good outcomes while excluding patients who experienced adverse events, inaccurately representing their quality.[xiii]
Quantros CareChex awards are fueled entirely by Medicare claims data and based solely on objective, quantifiable metrics.
What's the problem with survey or "self-reported" data?
Both self-reported and survey data suffer from a wide variety of well-known cognitive and reporting-based biases. Results derived from them are not necessarily associated with better quality patient outcomes. It also fails to capture the performance of any healthcare providers the patient doesn’t meet face to face, such as anesthesiologists, pathologist, or radiologists.
Do you adjust for risk?
Each patient is unique, with their own history, set of chronic conditions, and genetics, which results in some being much higher risk than others for experiencing an adverse event, such as a readmission, a mortality, or a complication. Some award methodologies, such as LeapFrog’s, don’t account for varying risk, which unjustly punishes hospitals who were willing to take on higher risk cases and rewards those hospitals who didn’t.[xiv]
What does risk adjustment do?
It levels the playing field to allow for fair comparisons between hospitals and also lets you to focus on true variance in care which may be driving patient outcomes, instead of patient characteristics misleading you to concentrate on things out of a healthcare provider’s control.
The two patients below both need their knee replaced. Are they at equal risk of experiencing complications from the procedure?


Bob Rogers had to see 3 different doctors before he found one willing to perform his knee surgery. Afterwards, due to his advanced age and diabetes he had a long hospital stay and suffered some complications. In a model that doesn’t adjust for risk, Bob’s doctor would get punished, despite doing his best to ensure Bob had a successful surgery.
Meanwhile, Thomas Spark gets his knee replaced by the first doctor Bob saw, the one who turned Bob away. Thomas is younger, and healthier, and has a successful surgery with no complications. Without risk-adjustment, Thomas’s doctor is rewarded for choosing healthier, less risky patients.
Quantros ensures all data is risk-adjusted, to create an even playing field when scoring and ranking hospitals.
What is the focus of the score?
Perhaps the biggest factor in variance across different scoring methods, is what is actually being examined when the score is calculated. Healthcare quality is a complicated, multi-faceted issue, and ranking systems must decide which factors are a priority and what contributes to overall quality of care. Further, how are these different elements weighted? For example, is cost as important as rate of complications?
Leapfrog is “focused exclusively on hospital safety.”[xv] To align with that mission, hospital safety makes up 50% of Leapfrog’s scores, but rates of mortality and readmissions are not considered at all.[xvi] Depending on the procedure, you may care more about mortality rates than you do rates of infection.
US News and World Report focuses specifically on difficult cases and complex patients. In their words, “The Best Hospitals specialty rankings are meant for patients with life-threatening or rare conditions who need a hospital that excels in treating complex, high-risk cases.”[xvii] In contrast to Leapfrog, US News only weighs patient safety as 5% of their total score, the majority of it’s score weighting is on patient mortality rates.[xviii] US News and World Report’s focus on the most complex cases also fuels their strident eligibility criteria. And while it’s great for high-risk patients with complex cases to have an aid in selecting their healthcare provider, the ranking may be less helpful for patients looking for more routine procedures.
CareChex awards look at five different quantifiable metrics and weighs them all equally when calculating hospital rankings: mortality, complications, readmissions, patient safety, and inpatient quality. Hospitals get scored in almost 40 different clinical categories, enabling easy focus on specific areas of care, whether that’s heart failure treatment, joint replacement, or pneumonia care.
How do different focuses affect hospital scores:
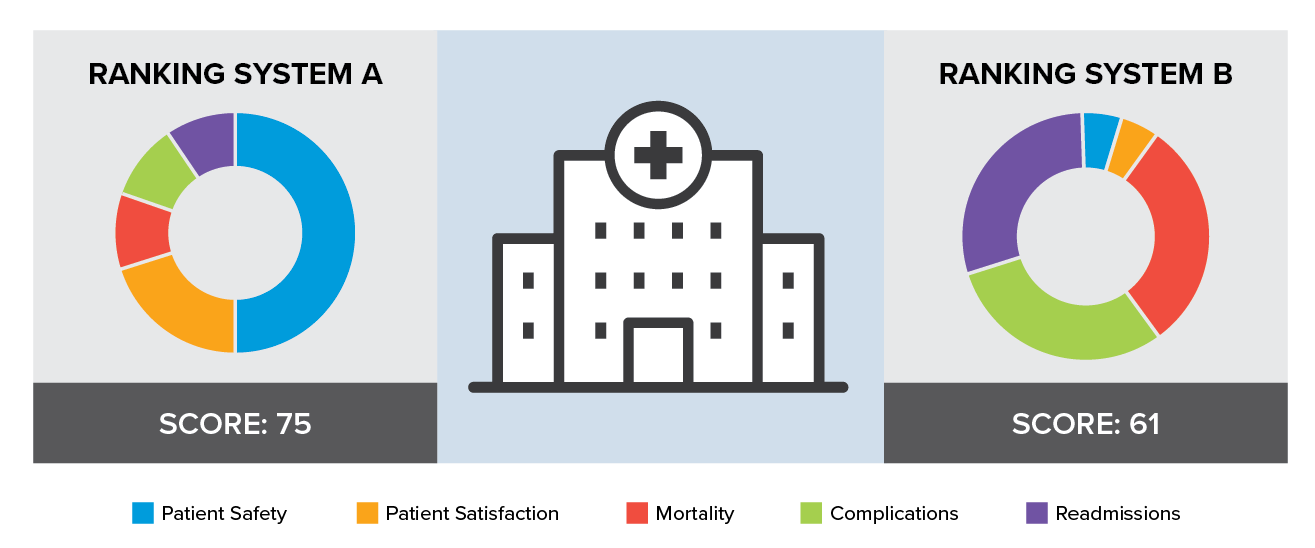
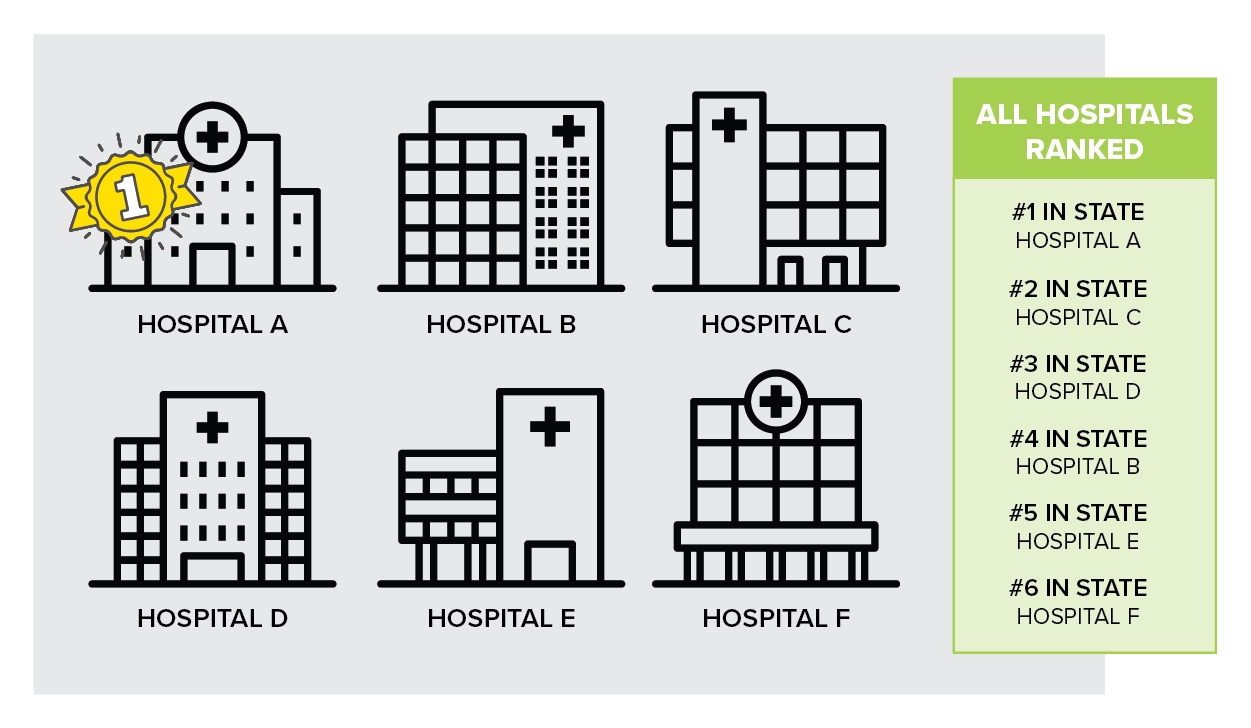
Different methodologies can result in the same hospital getting different scores from different ranking systems, even if those systems are looking at the same metrics.
Hospital quality awards provide a mechanism for guiding patients to better quality healthcare. The bottom line when comparing hospital quality rankings is to understand the data behind the awards. Answering questions such as which hospitals are included, which metrics are being evaluated, and is the data risk-adjusted can assist hospitals in choosing the award system that best represents accurate and objective hospital quality outcomes.
[i] J. Matthew Austin, Ashish K. Jha, Patrick S. Romano, et all, “National Hospital Ratings Systems Share Few Common Scores And May Generate Confusion Instead Of Clarity,” Health Affairs 32, no. 3 (March, 2015),
https://doi.org/10.1377/hlthaff.2014.0201.
[ii] Susan Morse, “See How Hospitals Did in CMS Overall Star Ratings,” Healthcare Finance, accessed September 30, 2020, https://www.healthcarefinancenews.com/news/hospital-star-ratings-show-about-equal-number-5-and-1-star-providers.
[iii] “FAQ: How and Why We Rank and Rate Hospitals,” U.S. News, accessed September 30, 2020 https://health.usnews.com/health-care/best-hospitals/articles/faq-how-and-why-we-rank-and-rate-hospitals
[iv] “2019 Leapfrog Top Hospitals,” The Leapfrog Group, accessed September 30, 2020, https://www.leapfroggroup.org/sites/default/files/Files/2019%20Top%20Hospitals%20Methodology_General.pdf.
[v]“Hospital Cohort Criteria,” Vizient, accessed September 30, 2020, https://newsroom.vizientinc.com/sites/vha.newshq.businesswire.com/files/doc_library/file/F19_VizTMPT_CohortCriteria.pdf.
[vi] Kate Goodrich, “Overall Hospital Quality Star Rating on Hospital Compare Public Input Request,” Vizient, accessed September 30, 2020, https://www.vizientinc.com/-/media/Documents/SitecorePublishingDocuments/Public/AboutUs/20190329_Vizient_Response_to_Request_for_Public_Input_Star_Ratings.pdf
[vii] Joshua J. Fenton, Anthony F. Jerant, Klea D. Bertakis; et al, “The Cost of Satisfaction A National Stufy of Patient Satisfaction, Health Care Utilization, Expenditures, and Mortality,” Arch Intern Med 172, no. 5, (March 2021): 405-411, doi:10.1001/archinternmed.2011.1662.
[viii] Fenton, Jerant, and Bartakis, “The Cost of Satisfaction,” 405-11.
[ix] “Overall Hospital Quality Star Rating on Hospital Compare Methodology Report (v3.0)”, CMS Quality Net, accessed September 28, 2020, https://www.qualitynet.org/files/5d0d3a1b764be766b0103ec1?filename=Star_Rtngs_CompMthdlgy_010518.pdf.
[x] U.S. News, “How and Why We Rank and Rate Hospitals.”
[xi] U.S. News, “How and Why We Rank and Rate Hospitals.”
[xiii] Shawna N Smith, Heidi Reichert, Jessica Amelin, Jennifer Meddings. “Dissecting Leapfrog: How well do Leapfrog Safe Practices Scores correlated with Hospital Compare ratings and penalties, and how much do they matter?” Med Car 55, no. 6, (June 2017): 606-614, doi: 10.1097/MLR.0000000000000716.
[xiv] “Frequently Asked Questions – General”, Leapfrog ACS Survey, accessed October 13, 2020, https://www.leapfroggroup.org/sites/default/files/Files/FAQs.pdf.
[xv] “Leapfrog Hospital Safety Grade,” The Leapfrog Group, accessed September 28, 2020, https://www.leapfroggroup.org/data-users/leapfrog-hospital-safety-grade.
[xvi] “Leapfrog Value-Based Purchasing Program,” The Leapfrog Group, accessed September 30, 2020.
[xvii] U.S. News, “How and Why We Rank and Rate Hospitals.”
[xviii] U.S. News, “How and Why We Rank and Rate Hospitals.”
[1] 2019 (Susan Morse, “See How Hospitals Did in CMS Overall Star Ratings,” Healthcare Finance, accessed September 30, 2020, https://www.healthcarefinancenews.com/news/hospital-star-ratings-show-about-equal-number-5-and-1-star-providers.)
[2] LeapFrog: https://www.hospitalsafetygrade.org/HospitalFAQ “more than 2600 hospitals are ranked every year”
[3] US World & News 2020-21 “A total of 1,889 hospitals met these standards and qualified for further consideration in at least one specialty.” (“FAQ: How and Why We Rank and Rate Hospitals,” U.S. News, accessed September 30, 2020 https://health.usnews.com/health-care/best-hospitals/articles/faq-how-and-why-we-rank-and-rate-hospitals)
[4] 2018: (Kate Goodrich, “Overall Hospital Quality Star Rating on Hospital Compare Public Input Request,” Vizient, accessed September 30, 2020, https://www.vizientinc.com/-/media/Documents/SitecorePublishingDocuments/Public/AboutUs/20190329_Vizient_Response_to_Request_for_Public_Input_Star_Ratings.pdf